Beyond the Four DORA Metrics: A Complete Guide to Engineering Performance Analysis
DORA metrics revolutionized how we measure software delivery. But after a decade of research, we're learning they're just the tip of the iceberg. Here's what they measure, what they miss, and why modern engineering teams need more.
If you’re searching for a “DORA analyzer,” you’re in the right place—but probably for different reasons than you expect.
Yes, we’ll cover how to analyse DORA metrics. We’ll explain what each metric measures, compare the major tools, and discuss best practices. But more importantly, we’ll show you why stopping at DORA metrics leaves you blind to the majority of what determines engineering success.
Think of this as the complete guide to DORA analysis—including the parts nobody talks about.
What DORA Metrics Actually Measure
The DevOps Research and Assessment (DORA) program has spent over a decade studying software delivery performance. Starting at Puppet Labs, then moving to Google Cloud, the research has surveyed more than 39,000 professionals across organisations of every size and industry.
The framework centers on four core metrics:
Deployment Frequency
How often your organisation successfully releases to production. This metric captures your ability to get value into users’ hands quickly.
| Performance Level | Deployment Frequency |
|---|---|
| Elite | On-demand (multiple times per day) |
| High | Between once per day and once per week |
| Medium | Between once per week and once per month |
| Low | Between once per month and once every six months |
Elite performers have moved beyond scheduled releases to continuous deployment. They’ve automated their pipelines to the point where deploying is a non-event—just another commit flowing through to production.
Lead Time for Changes
The time from code commit to code running in production. This captures your entire delivery pipeline—coding, review, testing, and deployment.
| Performance Level | Lead Time |
|---|---|
| Elite | Less than one hour |
| High | Between one day and one week |
| Medium | Between one week and one month |
| Low | Between one month and six months |
Lead time is perhaps the most revealing metric because it exposes every friction point in your delivery process. Long lead times typically indicate problems with code review bottlenecks, flaky tests, manual deployment steps, or change approval bureaucracy.
Change Failure Rate
The percentage of deployments that require remediation—rollbacks, hotfixes, or patches. This measures stability: are you shipping quality, or are you constantly fighting fires?
| Performance Level | Change Failure Rate |
|---|---|
| Elite | 0-5% |
| High | 5-10% |
| Medium | 10-15% |
| Low | 15-64% |
A low change failure rate indicates mature testing practices, good code review culture, and effective quality gates. High rates suggest teams are cutting corners, have inadequate testing, or are deploying without proper validation.
Time to Restore Service (MTTR)
When things break (and they will), how quickly can you recover? This metric measures resilience—your ability to detect problems and remediate them before they significantly impact users.
| Performance Level | Time to Restore |
|---|---|
| Elite | Less than one hour |
| High | Less than one day |
| Medium | Between one day and one week |
| Low | More than six months |
Fast recovery typically requires investment in monitoring, alerting, and incident response processes. Teams with low MTTR have practiced their response patterns, have runbooks for common issues, and can quickly identify root causes.
The Two Dimensions of Delivery
These four metrics elegantly capture two dimensions of software delivery:
Throughput (how fast you ship):
- Deployment Frequency
- Lead Time for Changes
Stability (how reliably you ship):
- Change Failure Rate
- Time to Restore Service
The research consistently shows that elite performers excel at both dimensions. Contrary to what many assume, speed and stability aren’t trade-offs—they reinforce each other. Teams that deploy frequently get faster feedback, catch problems earlier, and build confidence in their delivery process.
Why DORA Matters: The Research Foundation
DORA metrics aren’t just opinions—they’re backed by rigorous research correlating these measures with organizational outcomes. Understanding this research foundation helps you appreciate both DORA’s value and its limitations.
A Decade of Data
The DORA program began at Puppet Labs around 2013, moved to DevOps Research and Assessment as an independent organisation, and was later acquired by Google Cloud. Throughout these transitions, the research methodology remained consistent: large-scale surveys combined with statistical analysis to identify what actually predicts software delivery performance.
The 2024 Accelerate State of DevOps Report represents this tenth anniversary milestone. Over the years, the research has surveyed more than 39,000 professionals working at organisations of every size, from startups to enterprises, across technology, finance, healthcare, government, and other industries globally.
What the Research Proves
The data consistently shows that organisations performing well on these metrics are more likely to:
- Meet commercial and organizational goals: High performers are twice as likely to exceed their organizational performance targets
- Have higher employee satisfaction and retention: Teams that ship effectively experience lower burnout and better work-life balance
- Innovate faster than competitors: The ability to ship quickly translates to faster market response and experimentation
- Maintain stability while moving fast: The research debunks the myth that speed requires sacrificing quality
The Common Language Contribution
Before DORA, “we ship fast” meant different things to different people. An engineer might think deploying twice a week is frequent, while their manager expects daily deploys, and executives dream of continuous deployment. DORA introduced standardized benchmarks (elite, high, medium, low performers) that give teams a common language for discussing delivery performance.
This standardization has been enormously valuable. Teams can now objectively assess their performance, set concrete improvement targets, and communicate progress to stakeholders without subjective interpretation.
The 2024-2025 Evolution
The 2024 report highlighted the significant impact of AI on software development, explored platform engineering’s promises and challenges, and emphasized user-centricity and stable priorities for organizational success.
The 2025 report went further, moving away from simple league tables to introduce seven team archetypes that blend delivery performance with human factors like burnout, friction, and perceived value. This evolution reflects a growing understanding that speed without sustainability isn’t success.
The 2025 report also introduced the AI Capabilities Model—a companion guide that defines seven capabilities that amplify AI benefits. This acknowledges that AI adoption alone doesn’t guarantee improvement; how you implement AI matters enormously.
Key 2024 Findings Worth Noting
Several findings from the 2024 report deserve attention:
- More than 50% of respondents deploy less than once a week: Despite all the talk about continuous deployment, most organisations are nowhere near elite performance levels
- When deployments fail, 15% of teams need more than a week to recover: Recovery capability remains a major gap for many organisations
- Nearly half of respondents say their teams are operating ineffectively on at least one axis: Self-awareness of problems is high, but improvement remains challenging
These findings reveal that while DORA provides valuable benchmarks, most organisations have significant room for improvement on the basics before worrying about what’s beyond DORA.
The Critiques: Where DORA Falls Short
After a decade of adoption, we’re also learning DORA’s limitations. Here’s what the research and real-world experience reveal:
Lead Time Isn’t a Comprehensive Productivity Indicator
A study by BlueOptima examining contributions from over 600,000 developers cast significant doubt on Lead Time to Change as a standalone productivity benchmark. Their research found that lead time varies significantly based on code complexity, team size, and project type—making comparisons between teams or organisations misleading at best.
The study advocates for “a more nuanced, multidimensional approach to understanding productivity and quality in software development.” Lead time is one signal, not the whole picture.
The AI Productivity Paradox
Perhaps the most striking finding from recent research: AI coding assistants dramatically boost individual output while organizational delivery metrics stay flat.
Faros AI’s analysis of the 2025 DORA report found what they call “The AI Productivity Paradox”—developers using AI tools completed 21% more tasks and merged 98% more pull requests, but overall team delivery performance didn’t improve correspondingly.
Why? AI acts as an amplifier, not a universal productivity booster. If your processes have bottlenecks—code reviews that stack up, flaky test suites, complex deployment pipelines—generating more code faster just creates more congestion downstream.
Swarmia’s analysis of the DORA report put it bluntly: the results “should worry any engineering leaders trying to adopt AI without first establishing an effective engineering organisation.”
The implication is profound: DORA metrics might not even detect productivity gains from AI. If AI cuts coding time in half but reviews take twice as long because there’s more code to review, your lead time stays flat—or gets worse.
The Quality Blind Spot
For years, DORA’s four metrics had a quality gap. A team could deploy frequently with fast lead times, maintain a low change failure rate—and still be shipping buggy, unmaintainable code that passed basic tests but created long-term problems.
AI code exacerbates this. AI-generated code often looks fine on the surface: it passes tests, matches conventions, and reviewers approve it without much friction. But that doesn’t mean it’s production-ready. Edge cases and subtle bugs can hide in plain sight.
The 2025 DORA research found that around 30% of developers still don’t trust AI-generated output. These developers aren’t being Luddites—they’ve seen AI code that works in test environments but fails in production edge cases, or that introduces subtle performance regressions invisible to standard metrics.
Bottleneck Displacement
AI might cut coding time in half, but if reviews stack up or test cycles take forever, delivery doesn’t actually get faster. DORA metrics show you aggregate pipeline performance, but they don’t reveal where time accumulates.
Consider a team that adopts GitHub Copilot:
- Coding time drops from 4 hours to 2 hours
- But PR review queues grow from 2 hours to 6 hours (more PRs to review)
- And test suites take longer to run (more code, more tests)
Net lead time: unchanged. DORA metrics stay flat despite massive investment in AI tooling.
You need visibility into where time accumulates across the pipeline—not just the aggregate number. DORA doesn’t give you that.
Hidden Problems Behind “Good” Metrics
A flat change failure rate can hide growing problems. If your deployment frequency increases but your failure percentage stays constant, you’re actually experiencing more total failures. Ten percent of 50 deploys is five incidents. Ten percent of 200 deploys is twenty incidents.
Similarly, fast lead times might reflect small, safe changes rather than meaningful features. A team optimising for DORA numbers can game the metrics by shipping tiny increments that look impressive statistically but deliver minimal value.
What DORA Cannot Measure
The DORA team itself acknowledges these metrics don’t capture everything important:
- Customer satisfaction: Are you shipping things people want?
- Team dynamics: Is collaboration healthy? Are people burning out?
- Discovery work: Did you validate ideas before building them?
- Quality of individual work: Quantity is visible; quality isn’t
These aren’t minor gaps. They’re fundamental to whether your engineering organisation is successful.
The 2025 Rework Rate Addition
Recognizing that shipping faster doesn’t mean shipping better—especially when AI is writing chunks of the code—the 2025 DORA report introduced a fifth metric: rework rate.
Rework rate measures how often teams must push unplanned fixes to production, addressing a blind spot in the original four metrics. When AI-generated code passes initial tests but fails in production edge cases, rework rate captures that quality problem.
The Team Comparison Warning
In October 2023, the DORA team explicitly cautioned against using these metrics to compare teams. Creating league tables leads to unhealthy comparisons, counterproductive competition, and gaming the metrics. Yet many organisations still misuse DORA this way.
The DORA Metrics Tools Landscape
Before discussing what’s beyond DORA, let’s survey the tools that help you measure these metrics today. The market has matured significantly, with options ranging from free dashboards to enterprise platforms.
How to Evaluate DORA Tools
When choosing a DORA metrics tool, consider these factors:
Data Sources: Which systems does the tool integrate with? Most need access to your source control (GitHub, GitLab, Bitbucket), CI/CD pipelines (Jenkins, CircleCI, GitHub Actions), and possibly issue trackers (Jira, Linear, GitHub Issues).
Calculation Methodology: How does the tool define each metric? Some tools have opinionated definitions (e.g., what counts as a “deployment” or a “failure”). Others let you configure these definitions to match your organisation’s practices.
Security Considerations: Many tools require access to your source code or clone your repositories. For organisations with strict security requirements, this can be a dealbreaker.
Beyond DORA: Does the tool only track DORA metrics, or does it provide broader engineering analytics? Your needs today might expand tomorrow.
Pricing Model: Per-seat pricing can become expensive at scale. Some tools offer free tiers for DORA metrics specifically, with paid tiers for additional features.
Here’s how the major players compare:
LinearB
LinearB centers on workflow automation and team-level metrics. The platform maps how work moves through the delivery pipeline and applies programmable rules to routine steps like pull-request reviews, branch workflows, and handoff stages.
Strengths: Completely free DORA dashboard for teams of all sizes. Integrates with GitHub, Jira, and Slack. Strong workflow automation features.
Considerations: DORA metrics aren’t the main focus—they exist within a broader workflow platform. LinearB clones full repositories to compute metrics, which some organisations see as a security concern. Paid tiers start at $19 per contributor monthly.
Sleuth
Sleuth earned an A+ grade in comparative analyses for offering excellent features and accurate DORA metrics. The platform supports trunk-based development and integrates with CI/CD via webhooks or plugins.
Strengths: Real-time tracking of deployments and bottlenecks. Excellent DORA accuracy. Strong CI/CD integration.
Considerations: Free tier has severe user and data source restrictions. Primary focus is deployment tracking rather than broader engineering analytics.
Faros AI
Faros AI combines operational data from multiple sources and enhances them with machine learning signals. DORA metrics come standard, and the platform is extensible for custom dashboards.
Strengths: Handles complex environments spanning multiple repositories and pipelines. Excellent for organisations with sophisticated needs. Granular attribution.
Considerations: Oversimplifies Change Failure Rate. Reporting isn’t as straightforward—the platform encourages building your own analytics, which adds complexity.
Jellyfish
Jellyfish positions itself as an engineering management platform, with DORA metrics as one component of broader productivity measurement. Their 2025 State of Engineering Management Report surveyed 600+ engineering leaders.
Strengths: Strong AI productivity focus. Enterprise-oriented. Comprehensive engineering intelligence.
Considerations: Enterprise pricing. Primary value proposition extends well beyond DORA.
GetDX
GetDX focuses on developer experience, combining qualitative surveys with quantitative metrics. Founded by Abi Noda, the platform implements the SPACE framework alongside DORA.
Strengths: Best-in-class developer experience surveys. Research-backed approach. Strong SPACE framework integration. Extensive industry benchmarks.
Considerations: Survey-centric approach requires developer participation. Premium pricing for full capabilities.
Swarmia
Swarmia provides balanced metrics with a team-focused philosophy. Their platform implements all five SPACE dimensions and includes developer experience surveys.
Strengths: Research-backed approach. Team-focused (not individual) metrics. Includes DX surveys. Pragmatic implementation.
Considerations: Smaller organisation, though backed by notable investors.
Quick Comparison Table
| Tool | DORA Focus | Free Tier | Developer Experience | AI Analytics | Best For |
|---|---|---|---|---|---|
| LinearB | Medium | Yes (DORA only) | Limited | No | Workflow automation |
| Sleuth | High | Limited | No | No | Deployment tracking |
| Faros AI | Medium | No | No | Some | Complex environments |
| Jellyfish | Medium | No | Yes | Yes | Enterprise management |
| GetDX | Low | No | Primary focus | Yes | Survey-first orgs |
| Swarmia | Medium | Limited | Yes | Limited | Team-focused analytics |
The Missing Piece
Notice what’s missing from this comparison: discovery metrics, AI session analytics, and the ability to connect qualitative experience data with quantitative delivery data.
Most DORA tools answer “How fast are we shipping?” Few answer “Are we shipping the right things?” or “How sustainable is our pace?”
This brings us to what’s below the waterline.
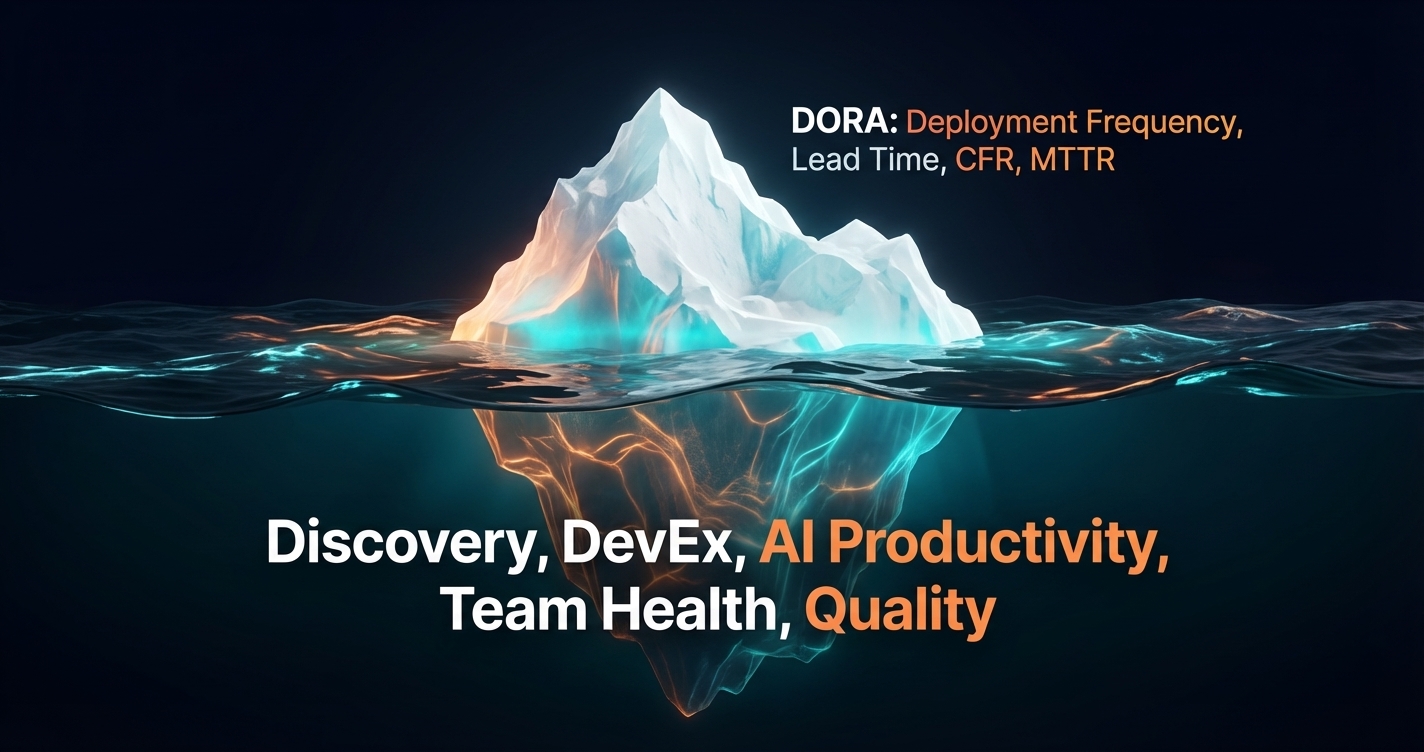
The Iceberg: What DORA Doesn’t Show You
Here’s the uncomfortable truth: DORA metrics measure the tip of the iceberg.
Think about what DORA captures: deployment frequency, lead time, failure rate, recovery time. These all measure delivery—how fast and reliably you get code to production.
Now think about everything below the waterline:
Discovery Work (30-40% of Engineering Time)
Before any code gets written, teams should be researching, validating, and planning. Teresa Torres, author of Continuous Discovery Habits, defines good discovery as “weekly touchpoints with customers by the team building the product, where they conduct small research activities in pursuit of a desired outcome.”
This work is invisible to DORA metrics. Consider two teams:
Team A: Spends three weeks conducting user interviews, prototyping solutions, testing assumptions. Then builds the validated solution in two weeks. Ships once.
Team B: Rushes to code immediately. Ships an initial version in one week. Gathers feedback. Ships fixes. Gathers more feedback. Ships again. Eventually gets to the right solution after six iterations over eight weeks.
DORA metrics make Team B look better: higher deployment frequency, short lead times, fast iteration. But Team A delivered the right thing with less total effort, less user frustration, and less technical debt.
Which team is actually more productive? DORA can’t tell you.
What Discovery Includes:
- User research and interviews
- Prototype testing
- Competitive analysis
- Technical feasibility spikes
- Assumption mapping and validation
- Opportunity prioritisation
None of this shows up in your deployment frequency.
Developer Experience and Satisfaction
High delivery velocity can mask unsustainable practices. A team hitting great DORA numbers while burning out isn’t successful—it’s a ticking time bomb.
The SPACE framework research from GitHub, Microsoft, and University of Victoria explicitly addresses this. Nicole Forsgren and colleagues found that “the perceptions of developers are an especially important dimension to capture.”
Consider this scenario from Jellyfish’s 2024 State of Engineering Management Report: 65% of all respondents experienced burnout in the past year. The problem was particularly acute for short-staffed engineers and leaders overseeing large organisations.
A burned-out team shipping daily is not sustainable. But DORA metrics only show the shipping—not the human cost.
What Developer Experience Captures:
- Job satisfaction and fulfillment
- Sustainable work pace
- Tool and process friction
- Learning and growth opportunities
- Psychological safety
- Work-life balance
DORA measures Performance and some Activity. It doesn’t measure Satisfaction, Communication, or Efficiency.
AI Productivity Patterns
With 90% of engineering teams now using AI coding tools (per Jellyfish’s 2025 survey), understanding how AI affects quality and productivity matters more than ever.
But DORA doesn’t capture any of the nuance:
- Are AI-assisted changes higher or lower quality?
- Which AI patterns produce maintainable code?
- Where does AI create technical debt?
- How does AI affect learning and skill development?
- Which prompting strategies yield the best results?
- How does AI usage vary across task types?
Data from GetDX shows that engineers who use AI daily reach onboarding milestones nearly twice as fast as non-users. That’s valuable information—but DORA metrics would never surface it.
Similarly, Teresa Torres recently warned that AI summaries can miss 20-40% of important detail when synthesizing customer research. If AI is used in discovery work, you need visibility into when it helps and when it hurts.
You need session-level analytics to answer these questions—not just deployment counts.
Qualitative Team Dynamics
Some of the most important factors in engineering success are invisible to metrics:
- Is knowledge shared or siloed?
- Do team members feel psychologically safe?
- Are retrospectives driving actual improvement?
- Is onboarding effective?
These only surface through qualitative measurement—surveys, interviews, self-assessment.
Research Validation Cycles
How do you know you’re building the right things? DORA tells you how fast you shipped. It doesn’t tell you:
- Was the feature validated before development?
- Did customers actually want this?
- What’s the adoption rate after release?
- How much rework came from requirement misunderstandings?
SPACE: The Framework DORA Doesn’t Cover
The SPACE framework emerged from research at GitHub, Microsoft, and the University of Victoria specifically to address productivity measurement’s complexity. It was developed by Nicole Forsgren (the “F” in DORA), along with Margaret-Anne Storey, Chandra Maddila, Thomas Zimmermann, Brian Houck, and Jenna Butler.
SPACE stands for:
Satisfaction and Well-being
How fulfilled and healthy are developers? This includes job satisfaction, meaningful work, avoiding burnout, and sustainable pace.
Example Metrics:
- Developer satisfaction scores (via surveys)
- Retention rates
- Burnout indicators
- Work-life balance ratings
DORA doesn’t measure any of this. You can have elite DORA scores while burning out your team.
Performance
What outcomes result from work? This is where DORA fits—deployment frequency, lead time, failure rates, and recovery time all measure delivery outcomes.
DORA’s Coverage:
- Deployment frequency ✓
- Lead time for changes ✓
- Change failure rate ✓
- Time to restore ✓
This is DORA’s home dimension—but it’s only one of five.
Activity
Observable actions like commits, reviews, deployments. DORA partially covers this through deployment frequency, but Activity is broader.
What DORA Misses:
- Code review participation patterns
- Documentation contributions
- Meeting load and collaboration time
- Discovery activities (research, prototyping)
Communication and Collaboration
How do people work together? This includes knowledge sharing, code review quality, cross-team coordination, and documentation practices.
Example Metrics:
- Knowledge distribution across team
- Review thoroughness and timeliness
- Cross-functional collaboration frequency
- Documentation quality and usage
DORA metrics tell you nothing about communication health.
Efficiency and Flow
Can people do work without impediments? This measures friction, context switching, flow state preservation, and tooling effectiveness.
Example Metrics:
- Focus time available per day
- Interruption frequency
- Tool satisfaction
- Process friction points
GetDX’s research on Netflix found they implemented “Deep Work Weeks” with no meetings after survey data revealed developers felt they lacked time for concentrated effort. The success was so evident that their entire infrastructure engineering organisation adopted the practice.
DORA can’t surface insights like this—you need qualitative measurement.
The SPACE Gap
DORA primarily covers Performance and some Activity. It barely touches Satisfaction, ignores Communication, and provides limited insight into Efficiency.
A complete picture requires all five dimensions. Any organisation that stops at DORA is measuring less than half of what matters.
The Discovery Gap
We’ve written extensively about The Discovery Gap—the blind spot that occurs when you measure delivery without measuring discovery.
The short version: traditional DX platforms tell you “You deployed 47 times this week” and “Your lead time is 2.3 hours.”
But they can’t tell you:
- Were those 47 deployments validated features or guesses?
- Are you shipping the right things, or just shipping things fast?
- How much work went into research and validation?
- What’s your hit rate on features customers actually use?
The Research Problem
Teresa Torres’s research shows that most product ideas don’t work. The exact failure rate varies by study, but it’s consistently high—often 70-80% of features fail to deliver expected value. If you’re not validating before building, you’re hoping you’re in the lucky minority—and the odds aren’t in your favor.
Yet most engineering teams spend 30-40% of their time on discovery work that never appears in their metrics. User interviews, prototype testing, competitive analysis, technical spikes—all invisible to DORA.
The Cost of Skipping Discovery
When teams don’t measure (and therefore don’t prioritise) discovery:
They Build the Wrong Things: Without validation, you’re guessing. Most guesses are wrong.
They Waste Resources: Building features nobody wants is expensive. Development time, code reviews, testing, documentation, maintenance—all wasted on the wrong thing.
They Accumulate Bad Technical Debt: Features built on unvalidated assumptions often need major rewrites when reality hits.
They Destroy Team Morale: Engineers, designers, and PMs feel demoralized when their work gets ignored or scrapped. High delivery velocity with low feature adoption is a recipe for burnout.
Discovery Metrics
Discovery metrics capture what delivery metrics miss:
- Customer touchpoint frequency: How often teams talk to customers (weekly is the standard)
- Validation rate: What percentage of hypotheses survive testing
- Learning velocity: How quickly teams invalidate bad ideas
- Research quality: Are insights documented and shared?
- Discovery-to-delivery ratio: How much discovery work precedes each feature?
Only by connecting discovery to delivery can you see the full picture. With discovery metrics, you can compare: “You deployed 47 times, but only 12 features had validated discovery.” That insight changes everything.
Beyond DORA: What Complete Engineering Analytics Looks Like
If DORA is the tip, what’s the whole iceberg?
Complete engineering performance analysis should cover:
Full DORA Metrics (Yes, Still Important)
Deployment frequency, lead time, change failure rate, and MTTR remain valuable signals. They’re just not sufficient on their own.
Discovery Metrics
- Research validation tracking
- Customer touchpoint frequency
- Hypothesis testing and outcomes
- Time from discovery to delivery
AI Session Analytics
- Quality patterns in AI-assisted development
- Productivity impact by use case
- Technical debt signals
- Learning and skill development
Developer Experience (SPACE-Aligned)
- Satisfaction surveys
- Friction point identification
- Flow state measurement
- Burnout early warning signals
Team Dynamics
- Collaboration patterns
- Knowledge distribution
- Communication health
- Psychological safety indicators
Connecting the Dots
The real power comes from correlating across these dimensions.
For example:
- “You deployed 47 times, but only 12 features had validated discovery”
- “Validated features ship 40% faster than unvalidated ones”
- “AI-assisted PRs have 15% higher rework rate—here’s why”
- “Teams with high satisfaction scores also have lower change failure rates”
These correlations only become visible when you measure both qualitative and quantitative, both discovery and delivery.
The Complete Picture
Here’s what a complete engineering performance analysis captures:
| Dimension | What Traditional Tools Measure | What Complete Analytics Add |
|---|---|---|
| Delivery | Deployment frequency, lead time, failure rate | Validated vs. unvalidated features |
| Discovery | Nothing | Research tracking, validation rates |
| Quality | Bug counts | AI quality patterns, technical debt signals |
| Experience | Nothing | Satisfaction, burnout, friction |
| Collaboration | PR review times | Team dynamics, knowledge distribution |
DORA gave us a common language for delivery performance. The next decade requires expanding that language to cover everything that makes engineering organisations successful.
Choosing Your Approach
If you’re just starting your metrics journey, DORA is a reasonable place to begin. The four metrics are well-understood, and many tools make them easy to track.
But if you’re finding that:
- Great DORA metrics don’t correlate with business outcomes
- Teams are burning out despite impressive numbers
- Features get shipped but don’t get used
- AI tools haven’t delivered expected productivity gains
Then you need to look below the waterline.
Getting Started: A Practical Roadmap
Moving beyond DORA doesn’t mean abandoning it. Here’s a practical approach to expanding your analytics:
Phase 1: Master the Basics
If you’re not already measuring DORA metrics, start there. Choose a tool from the landscape above, connect your data sources, and establish baselines. Understanding your current delivery performance gives you context for everything else.
Key Questions to Answer:
- What’s our actual deployment frequency?
- Where does time accumulate in our pipeline?
- How often do deployments fail?
- How quickly can we recover from incidents?
Phase 2: Add Developer Experience Signals
Once you have delivery metrics, add qualitative data about how your team experiences the development process. Run periodic surveys (quarterly is common) covering satisfaction, sustainability, and friction.
What to Measure:
- Overall job satisfaction
- Sustainable pace indicators
- Tool and process friction points
- Team collaboration quality
Correlate these with your DORA metrics. Are high-velocity teams also satisfied? Or is speed coming at the cost of burnout?
Phase 3: Track AI Impact
If your teams use AI coding tools (and most do now), add visibility into how AI affects your work. This goes beyond adoption counts to actual quality and productivity patterns.
What to Track:
- AI usage patterns by task type
- Quality differences in AI-assisted vs. non-assisted code
- Rework rates for AI-generated changes
- Developer confidence in AI output
Phase 4: Connect Discovery to Delivery
The most impactful expansion: track whether features were validated before building. This connects your shipping metrics to customer outcomes.
What to Measure:
- Research and validation activities
- Customer touchpoint frequency
- Hypothesis testing and outcomes
- Feature adoption rates post-release
Phase 5: Correlate Everything
The real insights come from connecting these dimensions. Which patterns predict success? Which combinations indicate problems?
Example Correlations:
- Discovery validation rate vs. feature adoption
- Developer satisfaction vs. change failure rate
- AI usage patterns vs. rework rate
- Team communication health vs. delivery velocity
The Future of Engineering Analytics
DORA gave us a foundation—a common language for discussing delivery performance and research proving that delivery capability matters.
The next decade requires expanding that foundation. As AI becomes ubiquitous, as discovery becomes increasingly important, as developer experience shapes competitive advantage—the four DORA metrics will remain necessary but insufficient.
The teams that will thrive aren’t just the ones that ship fast. They’re the ones that ship the right things, sustainably, while learning continuously.
That requires measuring more than DORA ever intended to capture.
Start Measuring What Matters
GuideMode provides complete engineering analytics—DORA metrics plus everything they miss. Discovery tracking, AI session analytics, developer experience surveys, and the correlations that connect them.
See how your engineering organisation really performs:
Start Free | Explore Discovery Analytics | See AI Productivity Features | View Pricing