Developer Burnout: What Your Metrics Aren't Telling You
65% of engineers experienced burnout last year. Your DORA metrics look great. These two facts aren't contradictory—they reveal a dangerous blind spot in how we measure engineering performance.
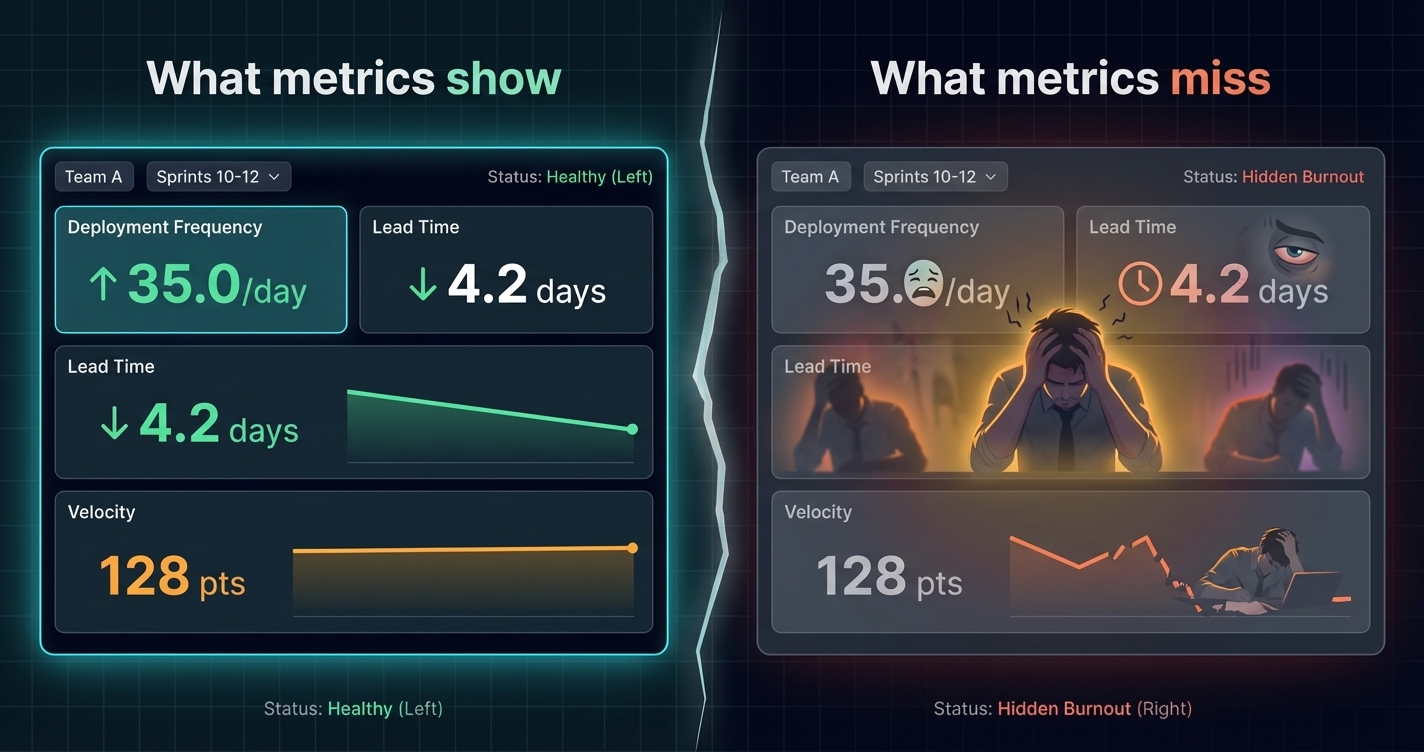
Your engineering dashboard shows all green:
- Deployment frequency: Up 40% this quarter
- Lead time: Down to 2.3 hours
- Change failure rate: Steady at 8%
- Team velocity: Consistently hitting sprint goals
Yet three of your best engineers have quit in the past six months. Exit interviews mention “unsustainable pace” and “constant pressure.” Your remaining team seems disengaged. 1:1s reveal frustration that nobody wants to discuss openly.
What’s happening?
You’re measuring delivery while ignoring the human cost of achieving it. Your metrics are telling you what the team produces, but they’re completely silent on whether the team can sustain that production.
This is the burnout blind spot—and it’s far more common than most engineering leaders realize.
The Scale of the Problem
Let’s start with the data that should alarm every engineering leader.
Jellyfish’s 2024 State of Engineering Management Report surveyed engineering professionals and found that 65% experienced burnout in the past year. The problem was particularly acute for:
- Engineers on short-staffed teams (forced to cover more ground)
- Leaders overseeing large organisations (stretched thin across responsibilities)
- Teams under pressure to adopt new technologies rapidly (especially AI tooling)
This isn’t a small sample. This is the majority of your industry experiencing burnout—while simultaneously reporting productivity gains.
The Paradox of Productive Burnout
Here’s what makes burnout so insidious: burned-out teams often look productive in the short term.
When engineers are burning out, they’re typically:
- Working longer hours (more output, temporarily)
- Cutting corners on quality to meet deadlines (faster delivery, more tech debt)
- Skipping breaks and vacations (sustained velocity, declining health)
- Reducing collaboration to focus on individual tasks (faster individual output, worse team outcomes)
All of these behaviors can look positive in traditional metrics. Deployment frequency might increase. Lead times might shrink. Sprint velocity might hold steady or even improve.
Until suddenly it doesn’t. Engineers quit. Quality collapses. Institutional knowledge walks out the door. The team that looked high-performing becomes a crisis.
Why Traditional Metrics Miss Burnout
The metrics most engineering teams track are fundamentally output-focused. They measure what gets produced, not what it costs to produce it.
DORA Metrics: Great for Delivery, Blind to Sustainability
The four DORA metrics—deployment frequency, lead time, change failure rate, and time to restore—tell you about your delivery pipeline’s health. They’re valuable for understanding how efficiently code moves from development to production.
But consider what they can’t tell you:
| What DORA Measures | What DORA Misses |
|---|---|
| How often you deploy | Whether the pace is sustainable |
| How fast changes move | Whether speed comes from overtime |
| How stable deployments are | Whether stability comes from fear |
| How quickly you recover | Whether incidents are burning people out |
A team deploying 10 times per day through healthy automation looks identical to a team deploying 10 times per day through heroic individual effort. The metrics don’t distinguish between sustainable excellence and unsustainable grind.
Velocity Metrics: The Acceleration Trap
Sprint velocity, story points completed, tickets closed—these metrics create a particularly dangerous dynamic. Once a team establishes a velocity baseline, any decrease feels like failure. Any increase becomes the new expectation.
This creates what researchers call the “acceleration trap”:
- Team achieves high velocity
- High velocity becomes the baseline
- Maintaining baseline requires sustained high effort
- Team pushes harder to avoid appearing to decline
- Burnout accumulates silently
- Performance eventually collapses
The metrics never showed a problem because the metrics only measure output, not effort.
Activity Metrics: Confusing Motion with Progress
Commits per day. Lines of code. PR throughput. These activity metrics are even more dangerous because they actively incentivize behaviors that accelerate burnout:
- Working longer hours (more commits)
- Skipping refactoring (more lines)
- Avoiding collaboration (faster individual throughput)
High activity metrics can actually be a warning sign of burnout, not a sign of health. But teams often interpret them positively.
The Signals Traditional Metrics Miss
Burnout manifests in patterns that standard engineering metrics don’t capture. Here’s what to watch for—qualitatively if you’re not measuring it quantitatively.
Declining Code Quality Over Time
Burned-out engineers take shortcuts. Not because they’re careless, but because they’re exhausted. Watch for:
- Increasing technical debt in retrospectives
- More bugs escaping to production (even if CFR stays flat due to quick hotfixes)
- Simpler solutions where more elegant approaches would be better
- Copy-paste patterns instead of proper abstractions
Reduced Collaboration
When overwhelmed, engineers retreat into individual work. Collaboration requires energy that burned-out people don’t have. Signals include:
- Shorter code reviews with fewer substantive comments
- Less participation in design discussions
- Knowledge siloing (only one person understands each area)
- Decreased mentoring of junior team members
Communication Pattern Changes
Pay attention to how people communicate:
- Shorter, terser messages
- Less participation in team channels
- Fewer questions asked (people don’t have energy to learn)
- More defensive responses to feedback
Calendar and Time Patterns
- Working outside normal hours consistently (not occasionally)
- Skipped or shortened breaks
- Vacation time not being used
- “Always on” availability expectations
The Absence of Joy
This is harder to quantify but important: burned-out teams stop enjoying their work. The energy and enthusiasm that characterizes healthy engineering teams disappears. People do their jobs but don’t engage beyond the minimum.
The Cost of Burnout
Burnout isn’t just a human problem—it’s a business problem. The costs are substantial and compounding.
Turnover Costs
When burned-out engineers leave:
- Recruiting costs: $15,000-$30,000+ per hire in engineering
- Onboarding time: 3-6 months to full productivity
- Knowledge loss: Institutional context that can’t be documented
- Team disruption: Remaining team members absorb extra work
The Society for Human Resource Management estimates that replacing an employee costs 50-200% of their annual salary when you factor in all costs.
Quality Costs
Burned-out teams produce lower quality work:
- More bugs reach production
- Technical debt accumulates faster
- Architecture decisions are made expediently rather than thoughtfully
- Documentation and tests get skipped
These quality issues compound over time, creating drag on future development.
Innovation Costs
Exhausted people don’t innovate. They execute the minimum required. This means:
- Fewer process improvements
- Less experimentation with new approaches
- Reduced creativity in problem-solving
- Missed opportunities that require proactive thinking
Team Morale Costs
Burnout is contagious. When some team members are burning out:
- Others pick up their slack, increasing their own burnout risk
- Cynicism spreads through the team
- Trust in leadership erodes
- The team’s ability to attract talent decreases
What Burnout-Aware Metrics Look Like
To detect burnout before it becomes a crisis, you need metrics that capture the human dimension of engineering work. This requires complementing quantitative delivery metrics with qualitative experience data.
Developer Experience Surveys
Regular surveys (quarterly is common) that ask developers directly about their experience. Key areas to measure:
Sustainable Pace
- “I can maintain my current work pace indefinitely” (Strongly Disagree → Strongly Agree)
- “I regularly work more than 40 hours per week to meet expectations”
- “I feel pressure to be available outside normal working hours”
Satisfaction and Fulfillment
- “My work feels meaningful and impactful”
- “I’m learning and growing in my role”
- “I would recommend my team as a great place to work”
Support and Resources
- “I have the tools and resources I need to do my job well”
- “When I’m blocked, I can get help quickly”
- “My manager supports my wellbeing, not just my output”
Recovery and Balance
- “I can fully disconnect from work during off-hours”
- “I feel comfortable taking time off when I need it”
- “I’ve taken adequate vacation time this year”
The SPACE framework from Microsoft, GitHub, and University of Victoria explicitly includes Satisfaction as a core dimension of developer productivity. This isn’t soft—it’s research-backed recognition that sustainable performance requires healthy people.
Workload Distribution Analysis
Beyond surveys, analyse how work is distributed:
- Bus factor by area: How many people understand each part of the system?
- Load concentration: Are certain individuals carrying disproportionate load?
- After-hours activity: How much work happens outside normal hours?
- Meeting burden: How much time is consumed by meetings vs. focused work?
GetDX’s research found that developers lose an entire day each week to inefficiencies—meetings, context switching, waiting for answers. That’s 20% of capacity lost to friction, forcing people to work harder to accomplish the same outcomes.
Leading Indicators vs. Lagging Indicators
Traditional burnout metrics are lagging—they tell you burnout happened:
- Turnover rates (too late—people already left)
- Sick day usage (burnout has already manifested physically)
- Performance decline (damage is done)
Better metrics are leading—they predict burnout before it happens:
- Survey trends over time (are satisfaction scores declining?)
- Workload distribution changes (is load concentrating on fewer people?)
- Collaboration pattern shifts (is teamwork declining?)
- Time-off usage trends (are people not taking vacation?)
Correlating Experience with Output
The most powerful insights come from connecting qualitative experience data with quantitative delivery data.
For example:
- Teams with high satisfaction scores: What are their delivery metrics?
- Teams with declining survey scores: How do their quality metrics compare?
- Individuals flagged for burnout risk: What does their activity pattern look like?
These correlations help you understand whether your delivery performance is sustainable or borrowed against future capacity.
Building a Burnout-Resistant Team
Detection is only half the challenge. Here’s how to build engineering teams that perform sustainably.
Normalize Sustainable Pace
Make it clear—through actions, not just words—that sustainable pace is expected:
- Don’t reward heroics: When someone saves a deadline through overtime, address the planning failure that made it necessary
- Model behaviour from leadership: If managers work weekends, the team will too
- Track and discuss workload: Make capacity a regular conversation topic
Create Psychological Safety Around Workload
People need to feel safe saying “I’m overwhelmed” without fearing career consequences:
- Regular 1:1s that explicitly ask about workload
- Team retrospectives that discuss capacity, not just output
- Clear escalation paths for unsustainable situations
Protect Focused Time
The research is clear: context switching and meeting overload contribute to burnout. Protect focused work time:
- Meeting-free days or half-days
- “Core hours” for collaboration with protected time outside
- Asynchronous communication defaults
- Interruption norms (when is it okay to interrupt someone?)
Netflix famously implemented “Deep Work Weeks” after survey data revealed developers felt they lacked time for concentrated effort. The practice was so successful that their entire infrastructure engineering organisation adopted it.
Build Redundancy
Single points of failure in systems are bad. Single points of failure in teams are worse. Ensure:
- At least two people understand each critical area
- Documentation that enables handoff
- Regular knowledge sharing sessions
- Rotation of on-call and interrupt-driven work
Address Root Causes
When burnout signals appear, dig into root causes:
- Is it a planning problem (consistently underestimating work)?
- Is it a staffing problem (team is genuinely under-resourced)?
- Is it a process problem (friction consuming capacity)?
- Is it a scope problem (too many priorities)?
Telling a burned-out team to “practice self-care” while maintaining the conditions that caused burnout accomplishes nothing.
The Metrics Stack for Sustainable Performance
Here’s what a complete picture looks like—measuring both what you deliver and what it costs to deliver it:
Layer 1: Delivery Metrics (What You Produce)
- Deployment frequency
- Lead time for changes
- Change failure rate
- Time to restore service
- Feature adoption rates
Layer 2: Experience Metrics (How It Feels)
- Developer satisfaction scores
- Sustainable pace indicators
- Tool and process friction
- Learning and growth sentiment
- Team collaboration health
Layer 3: Workload Metrics (What It Costs)
- After-hours activity
- Meeting burden
- Load distribution
- Vacation usage
- Turnover and retention
Layer 4: Correlation Analysis (What It Means)
- Satisfaction vs. delivery performance
- Workload vs. quality metrics
- Experience trends vs. retention
- Sustainable pace vs. long-term velocity
Only by combining all four layers can you understand whether your engineering organisation is performing sustainably or heading toward a cliff.
Warning Signs in Your Data
If you’re already measuring some of these dimensions, here are specific patterns that should trigger concern:
Red Flags in Survey Data
- Sustainable pace scores below 3.0/5.0
- Declining satisfaction trend over 2+ quarters
- Large variance between teams (some burned out, some fine)
- Gap between manager and IC perceptions
Red Flags in Activity Data
- Consistent after-hours commits from same individuals
- Decreasing code review depth over time
- Vacation balances accumulating without usage
- On-call incidents not distributed evenly
Red Flags in Delivery Data
- Velocity maintained but quality declining
- Fast lead times but increasing tech debt
- High deployment frequency but low feature adoption
- Good DORA metrics but high turnover
The Dangerous Combination
The most dangerous situation: excellent delivery metrics combined with declining experience metrics. This indicates the team is hitting numbers through unsustainable effort. The metrics look great until they suddenly don’t.
Taking Action
If you recognize burnout patterns in your organisation, here’s a practical response framework:
Immediate (This Week)
- Have honest conversations with team members showing warning signs
- Identify any immediate workload that can be deprioritized or delayed
- Ensure affected individuals know support is available
Short-term (This Month)
- Implement or expand developer experience surveys
- Review workload distribution and address imbalances
- Establish meeting-free time blocks
- Address any “always on” cultural expectations
Medium-term (This Quarter)
- Build redundancy in high-risk areas (knowledge concentration)
- Review planning processes to prevent systematic overcommitment
- Establish burnout metrics as regular leadership review items
- Train managers on burnout recognition and response
Long-term (Ongoing)
- Make sustainable pace a core engineering value
- Include experience metrics in performance discussions
- Celebrate sustainable delivery, not heroic effort
- Regular review of workload, capacity, and wellbeing
The Bottom Line
Your DORA metrics can look perfect while your team burns out. Velocity can hold steady while your best people plan their exit. Delivery can continue until suddenly it collapses.
The organisations that will sustain high performance aren’t the ones that extract maximum short-term output from their teams. They’re the ones that build systems—both technical and cultural—that enable people to do excellent work indefinitely.
This requires measuring what traditional metrics miss: how the work feels, what it costs, and whether the pace is sustainable. It requires treating developer experience not as a “nice to have” but as a leading indicator of organizational health.
65% of engineers experienced burnout last year. That’s not a statistic about other companies—it’s a statistic about your industry. The question isn’t whether burnout exists on your team. The question is whether you’re measuring it, and whether you’re doing anything about it.
Measure What Matters
GuideMode combines delivery metrics with developer experience analytics—giving you the complete picture of engineering performance. Track DORA metrics alongside satisfaction, sustainable pace, and workload distribution. Spot burnout signals before they become retention crises.